
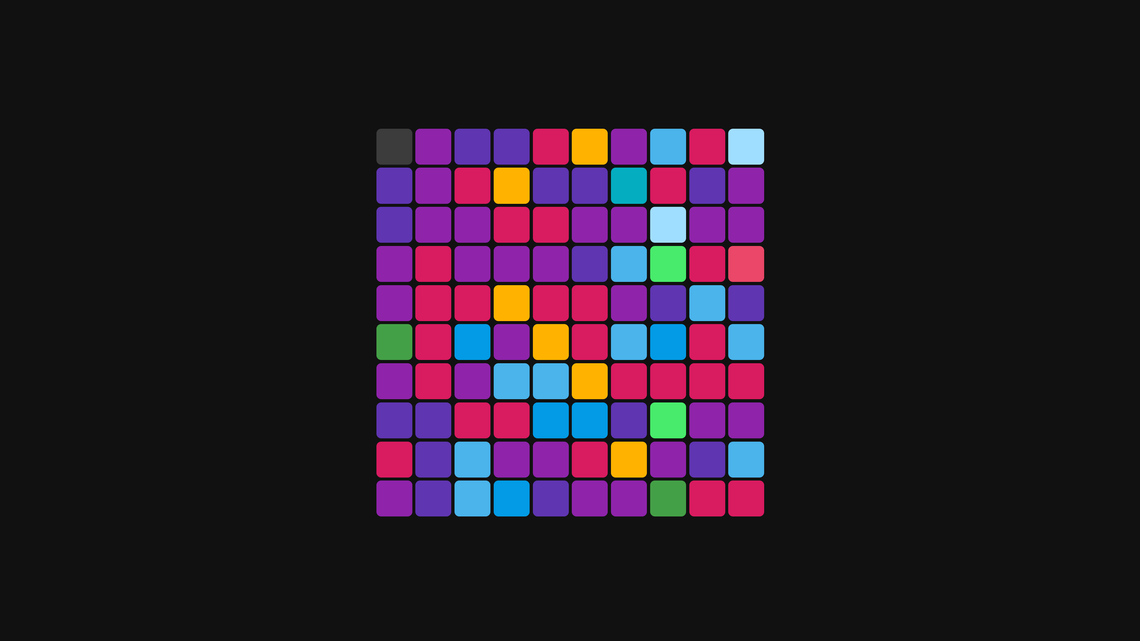
Grid
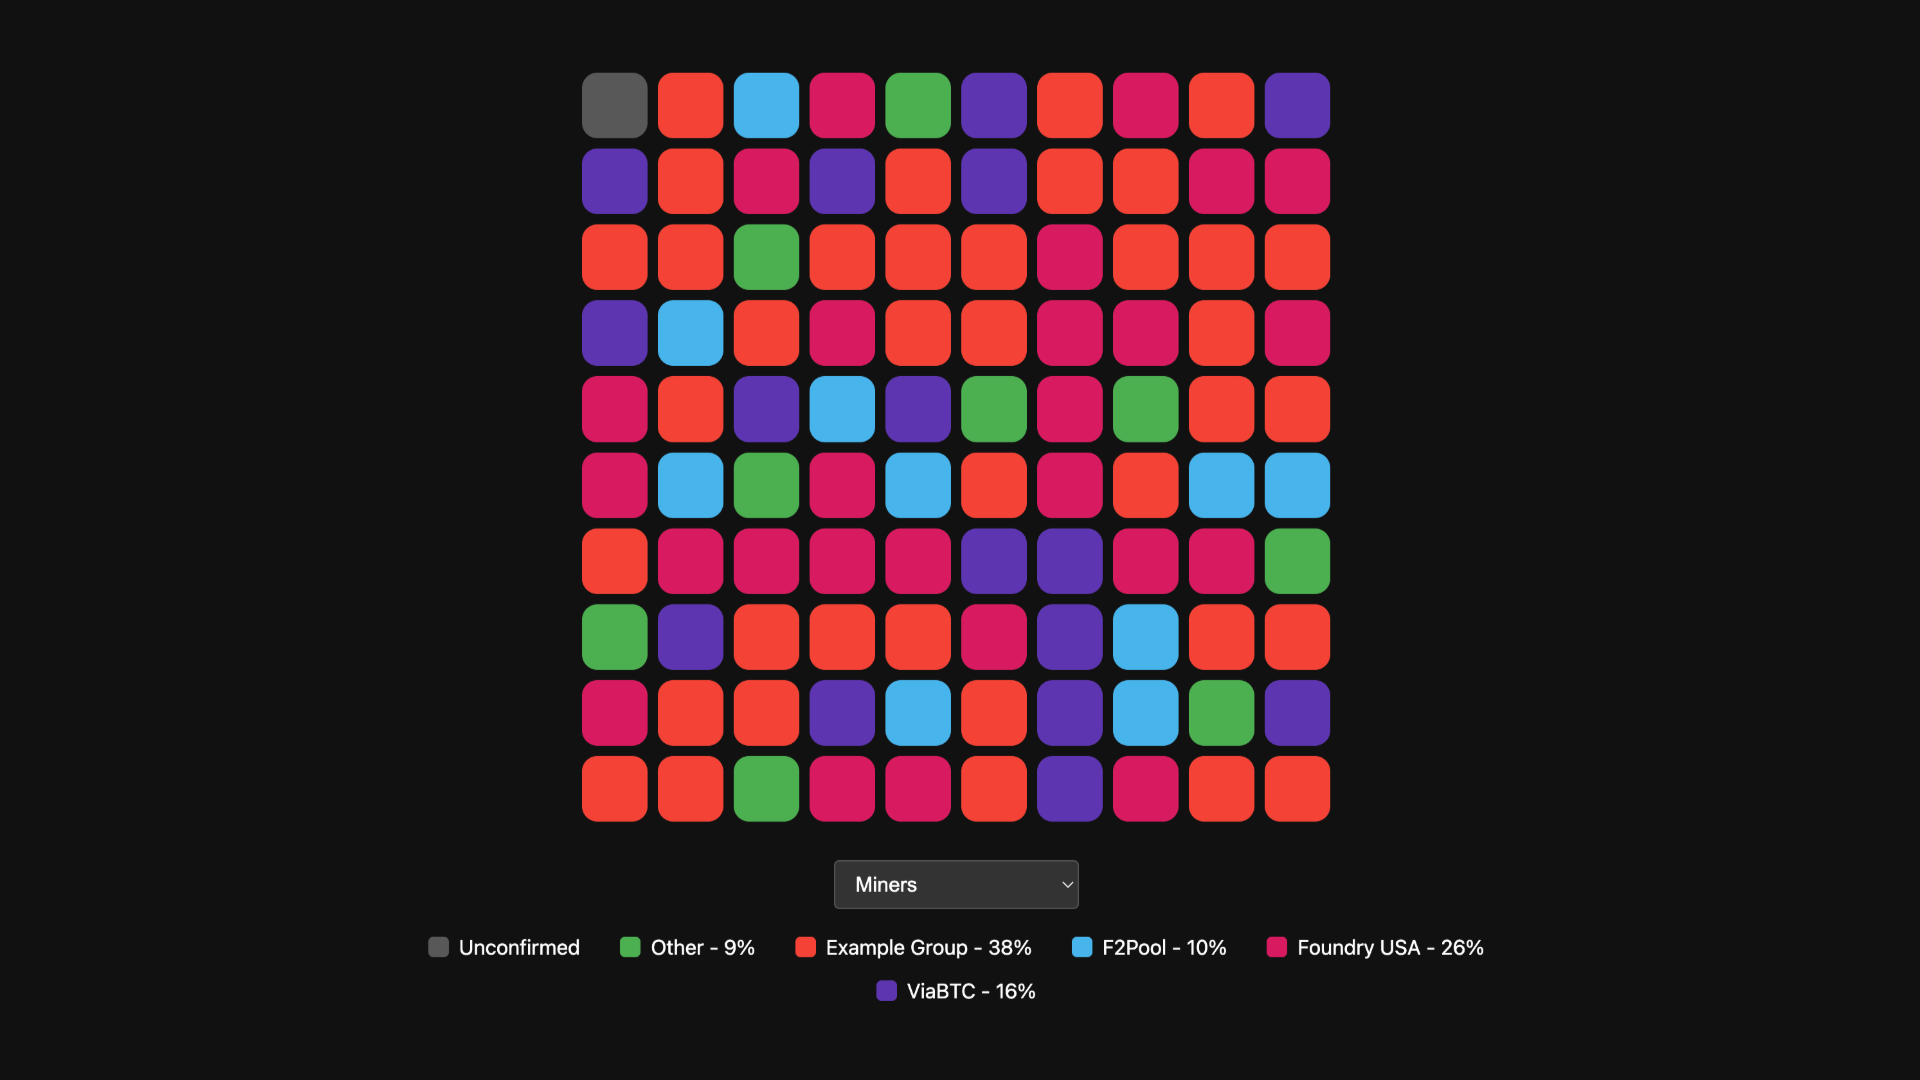
Using the mempool.space API we can quickly fetch the most recent 99 blocks, and display useful information about recent blocks at a glance using a new visualisation approach.
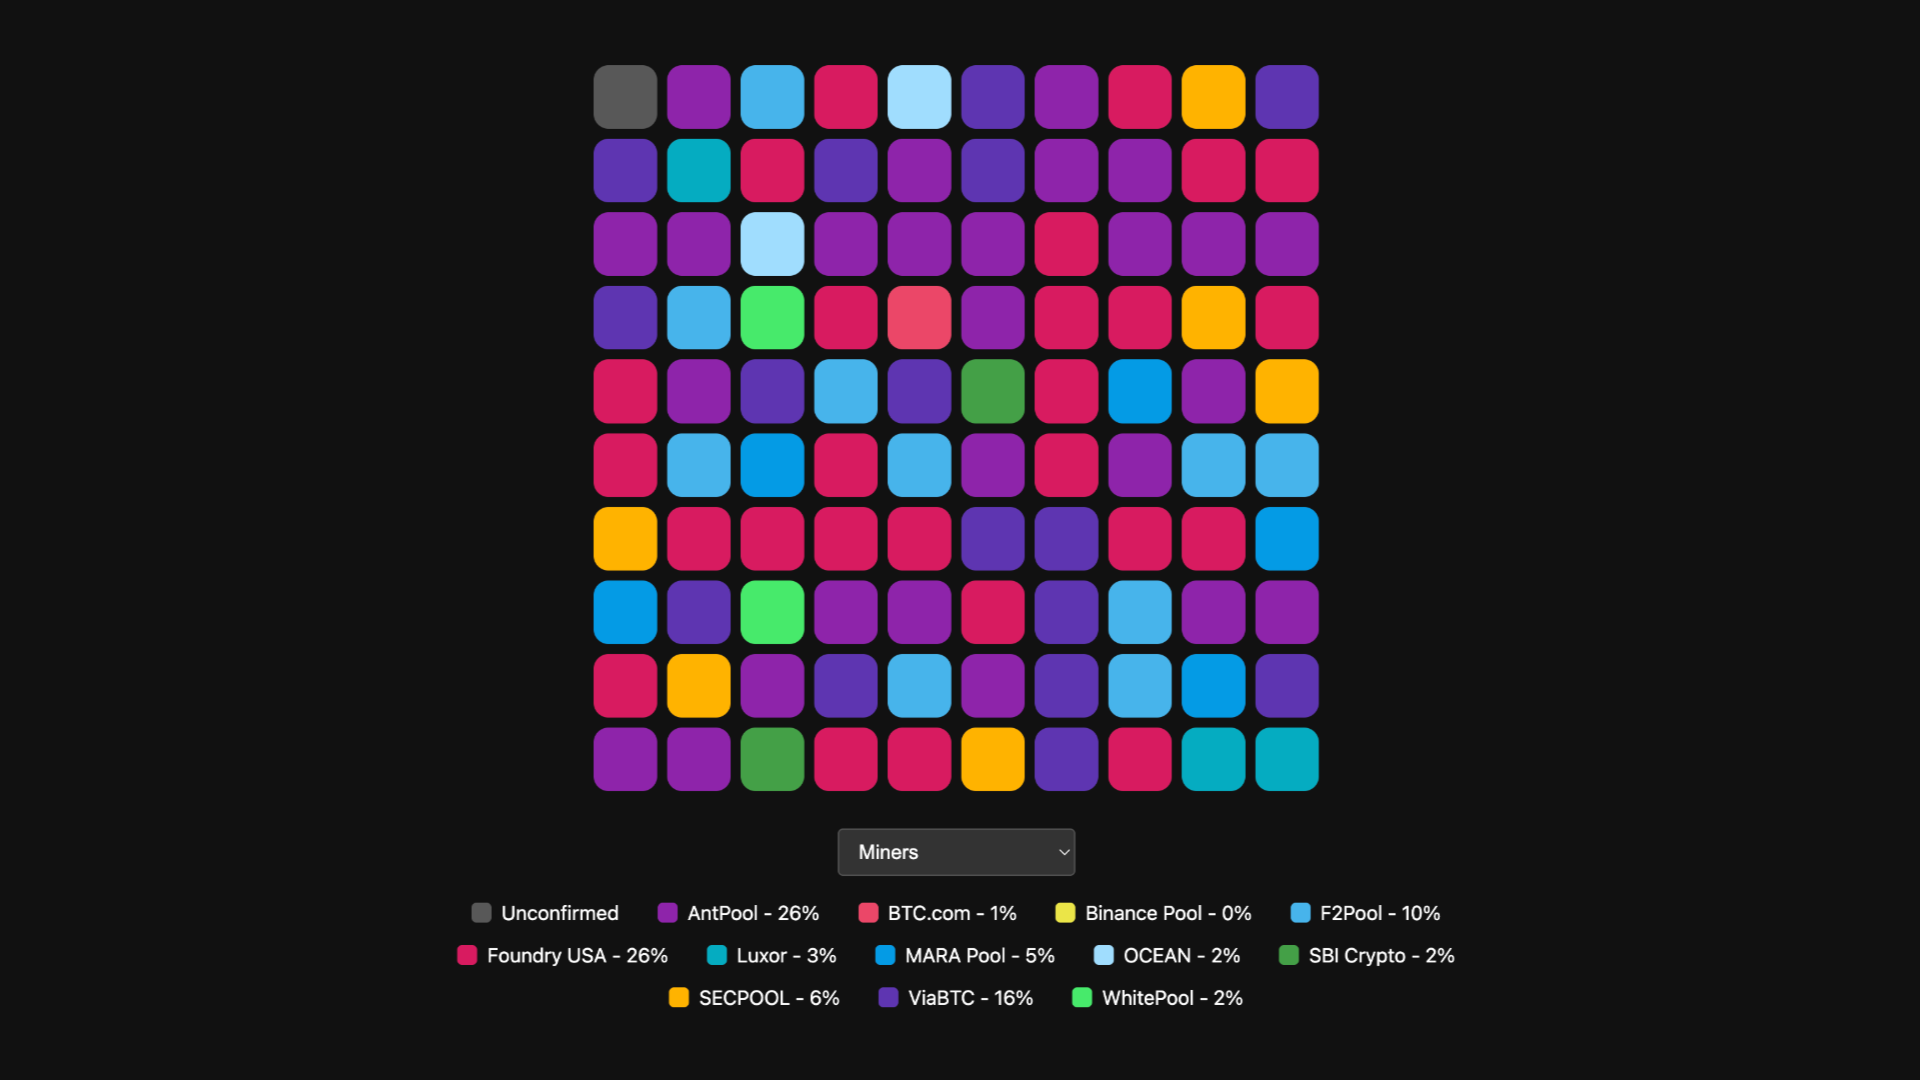
Miners
We can colour code each block based on which miner found it, giving us a nice visual representation of the last 16h or so of blocks.
Mining Proxies
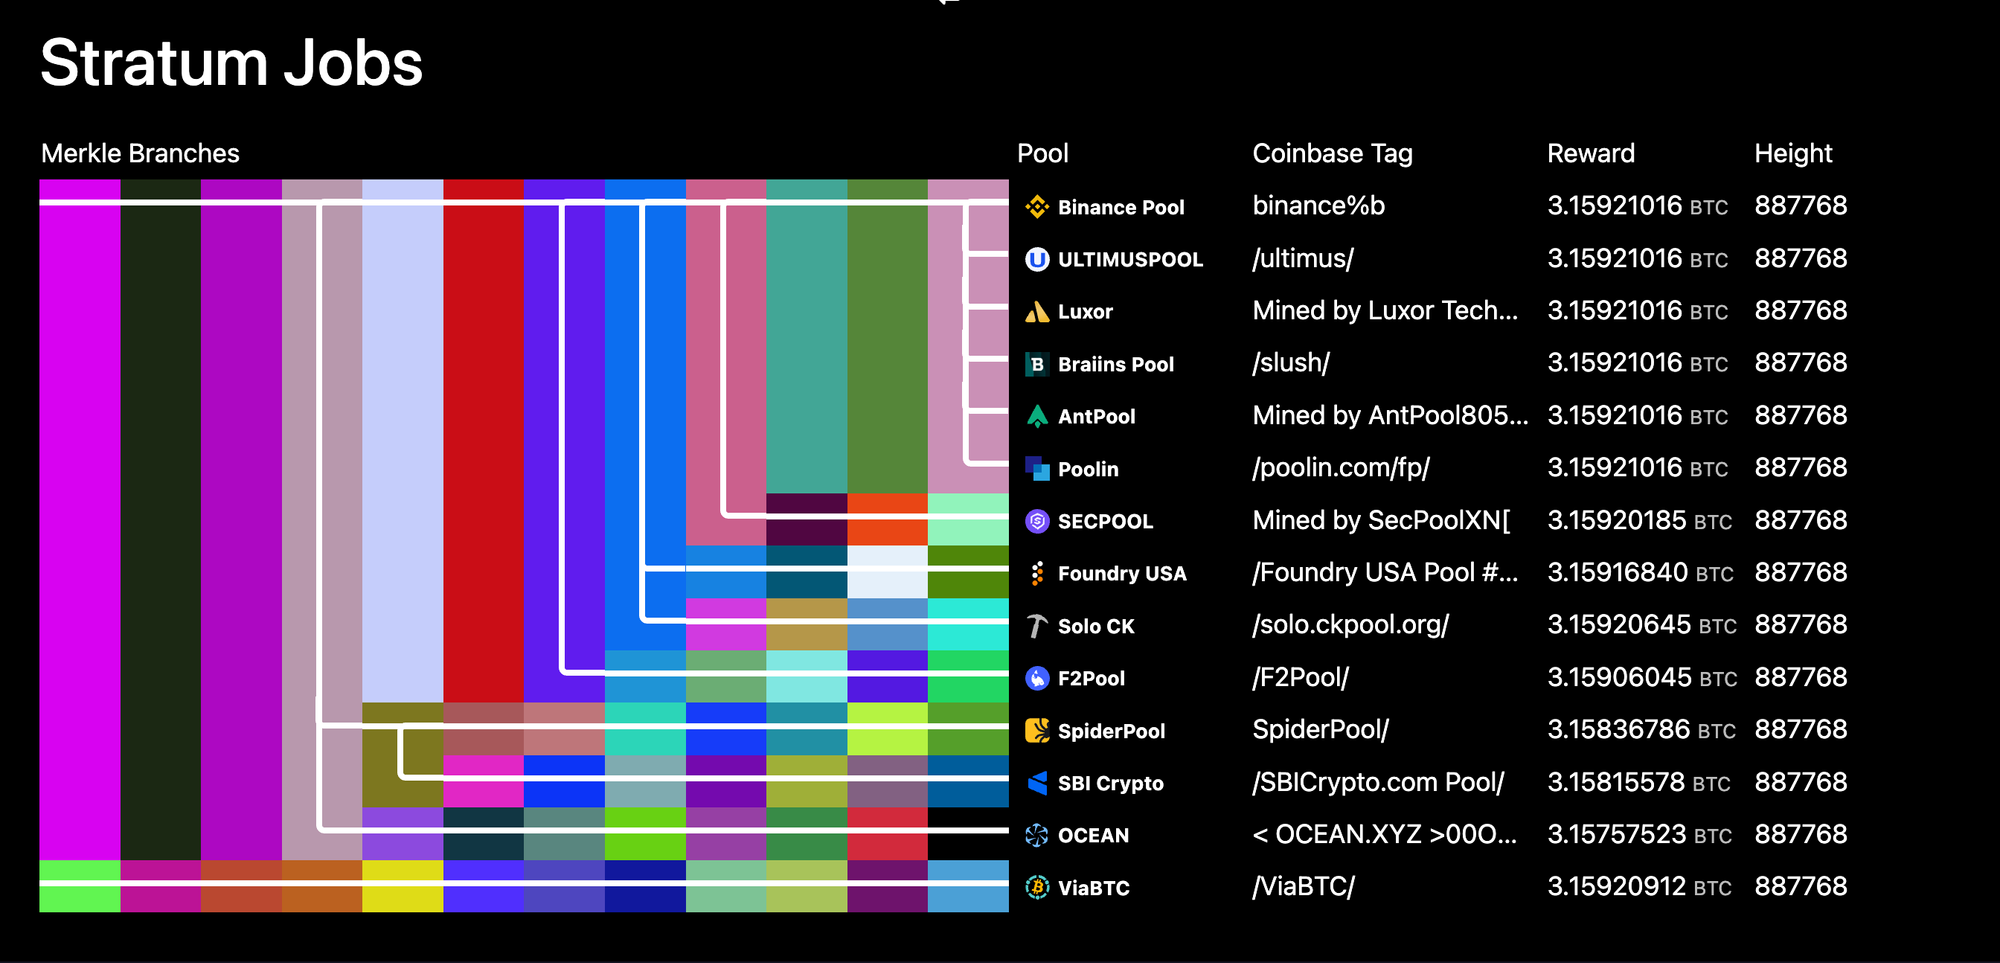
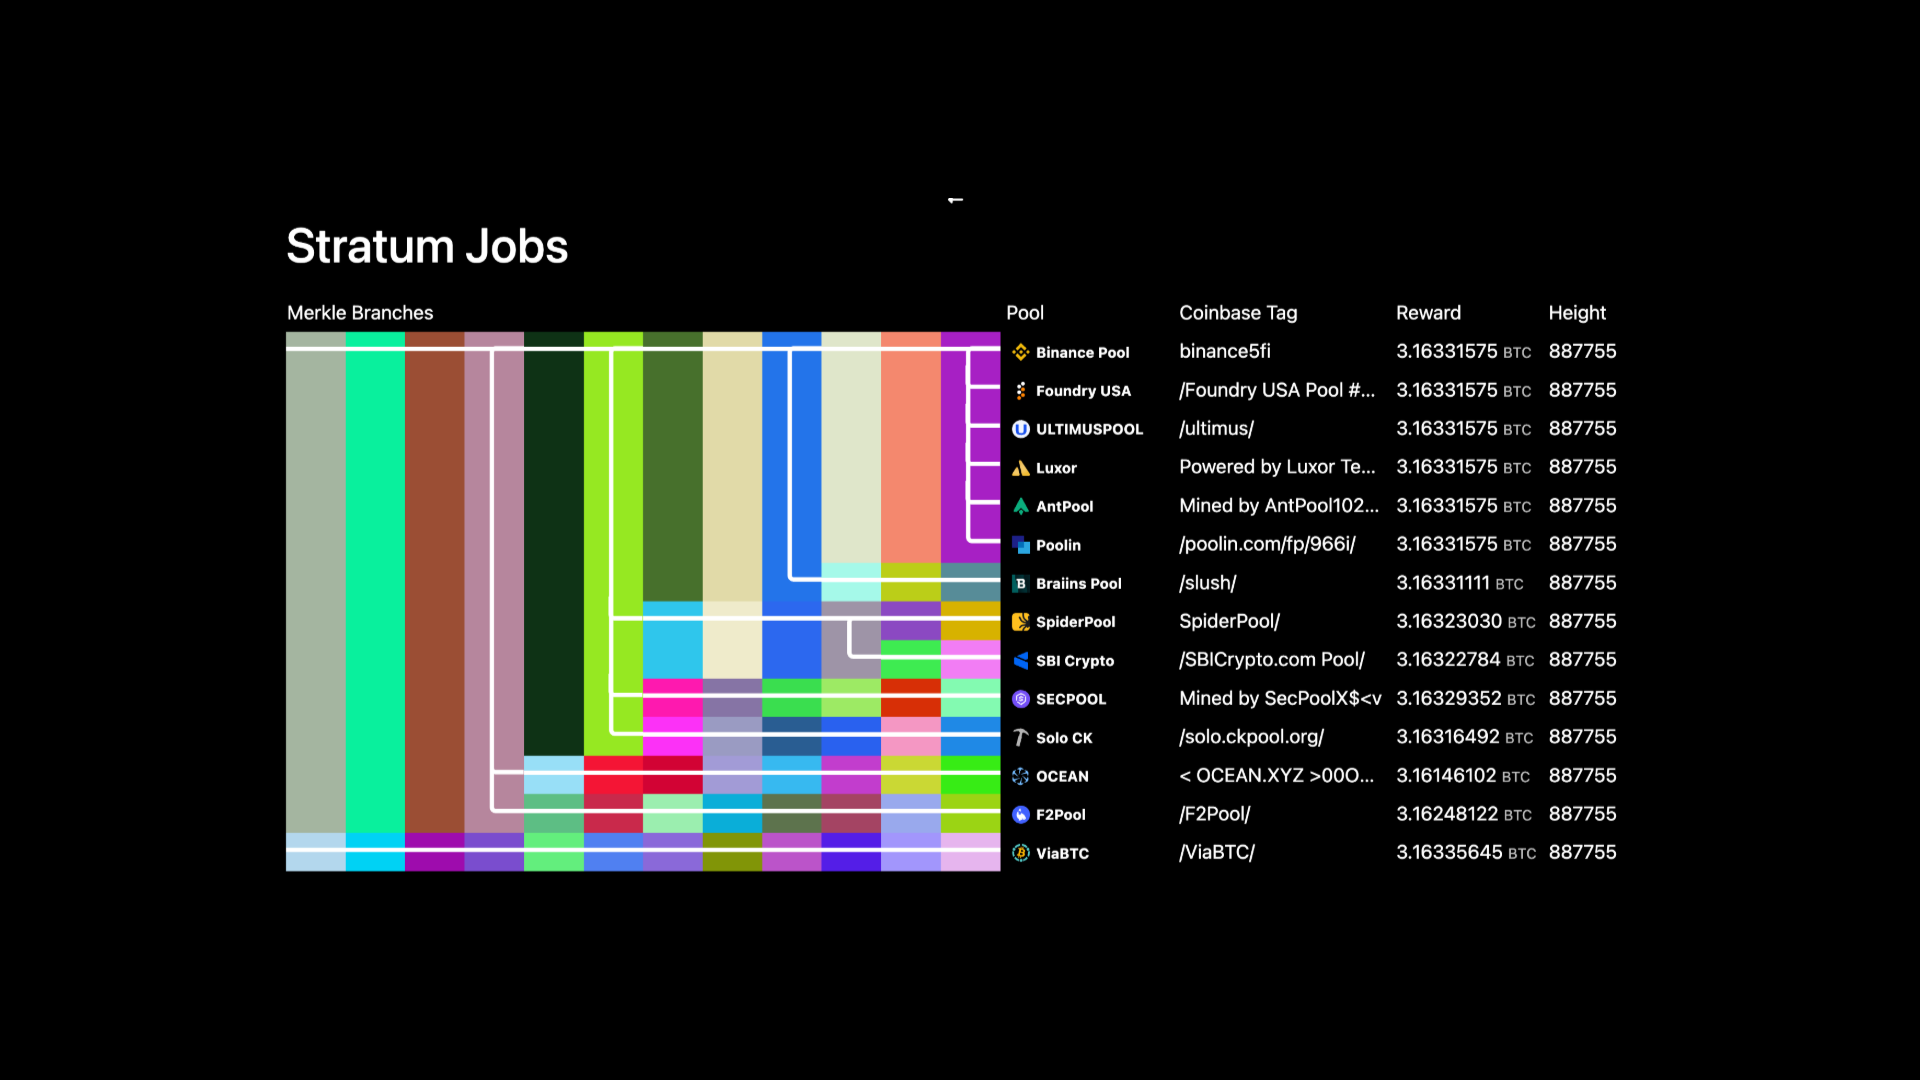
There is much debate and discussion around common block templates and possible proxy pools. For example, a quick look at the mempool stratum job visualiser at any random time will reveal that bunch of pools all sending the exact same set of transactions. We might want to see what the impact on block template diversity is if this example set of miners were acting as single group.
To explore the effect of a group, you can go to grid.orange.surf create a custom group, give it a name and select a custom colour for your group.
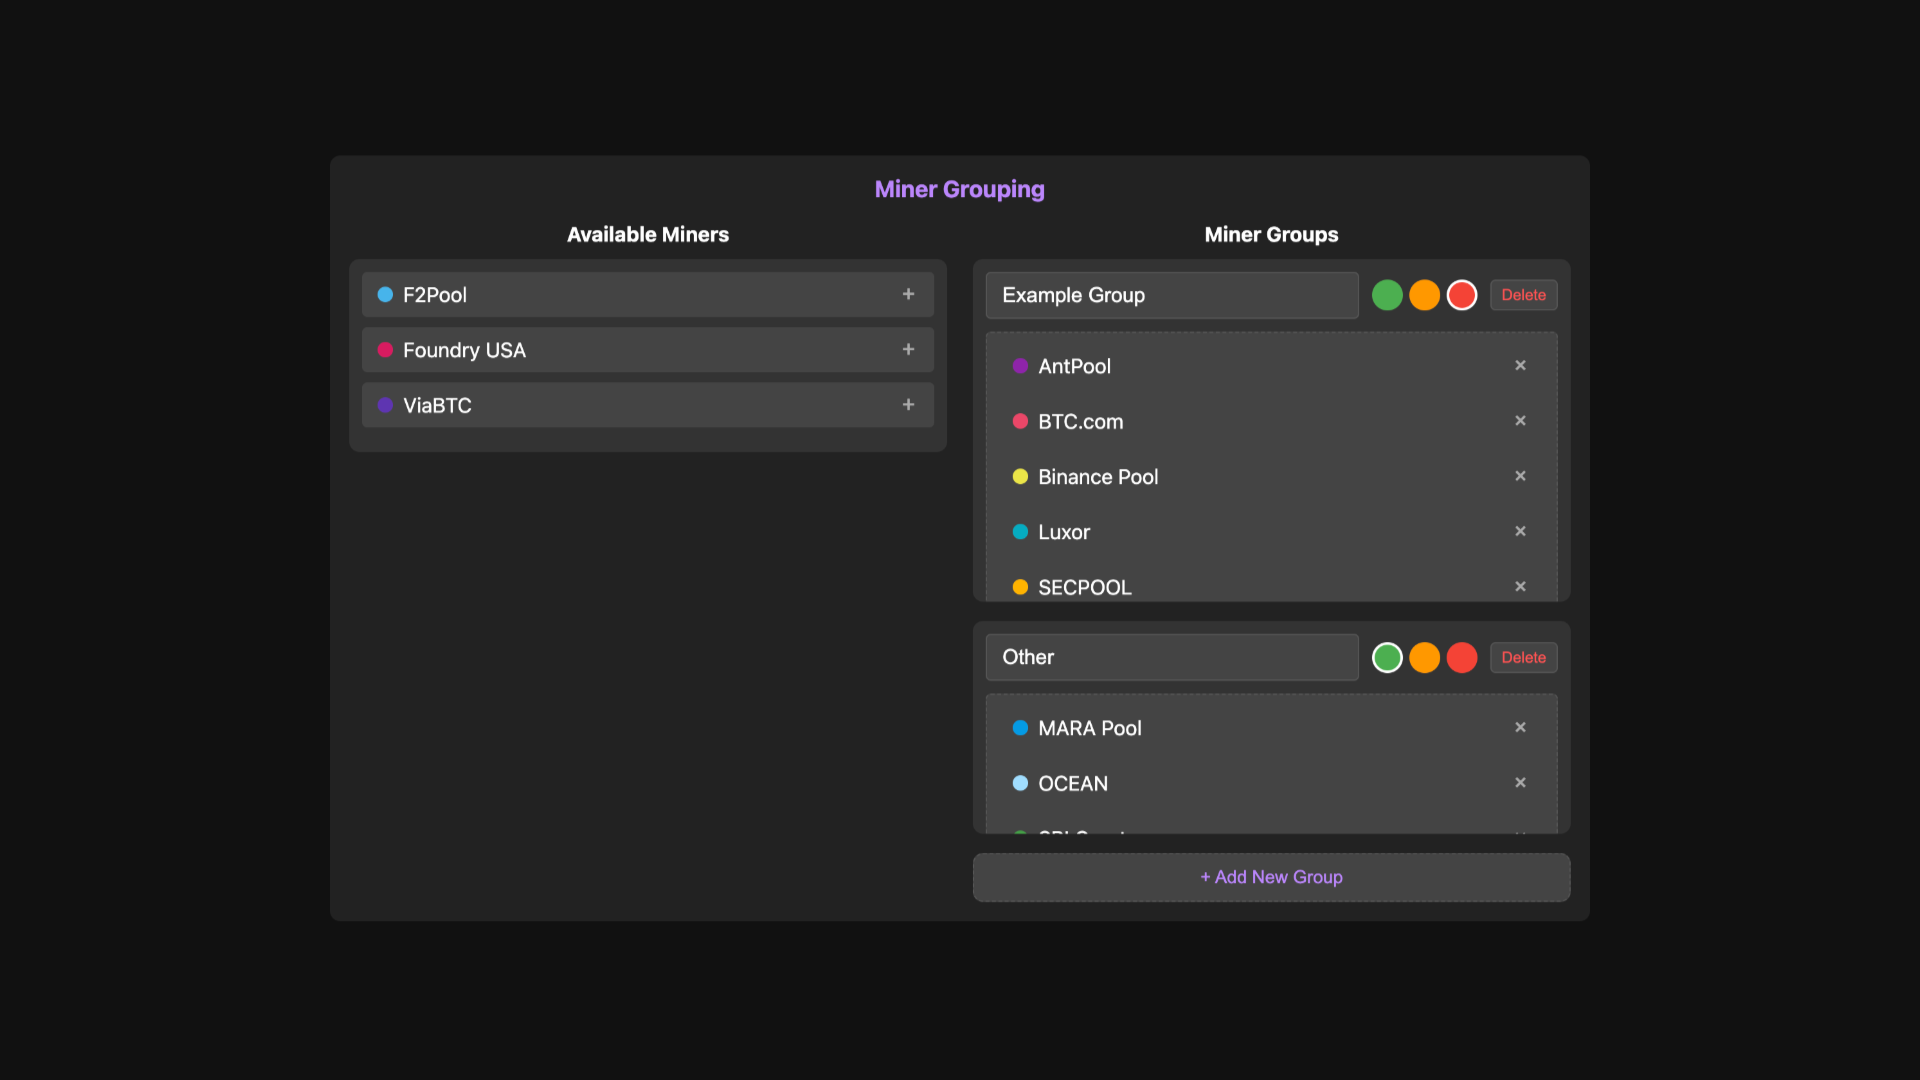
The block colour and legend auto update as you make changes, and all the info is stashed in the URL so you can easily share the link, e.g. for this grouping the link is:
https://grid.orange.surf/?metric=miners&minerGroups=Example+Group%3Ared%3AAntPool%2CBTC.com%2CBinance+Pool%2CWhitePool%2CSECPOOL%2CLuxor%7COther%3Agreen%3AMARA+Pool%2CSBI+Crypto%2COCEAN
Make your own groupings and share them in your blog posts on proxy pool speculation!
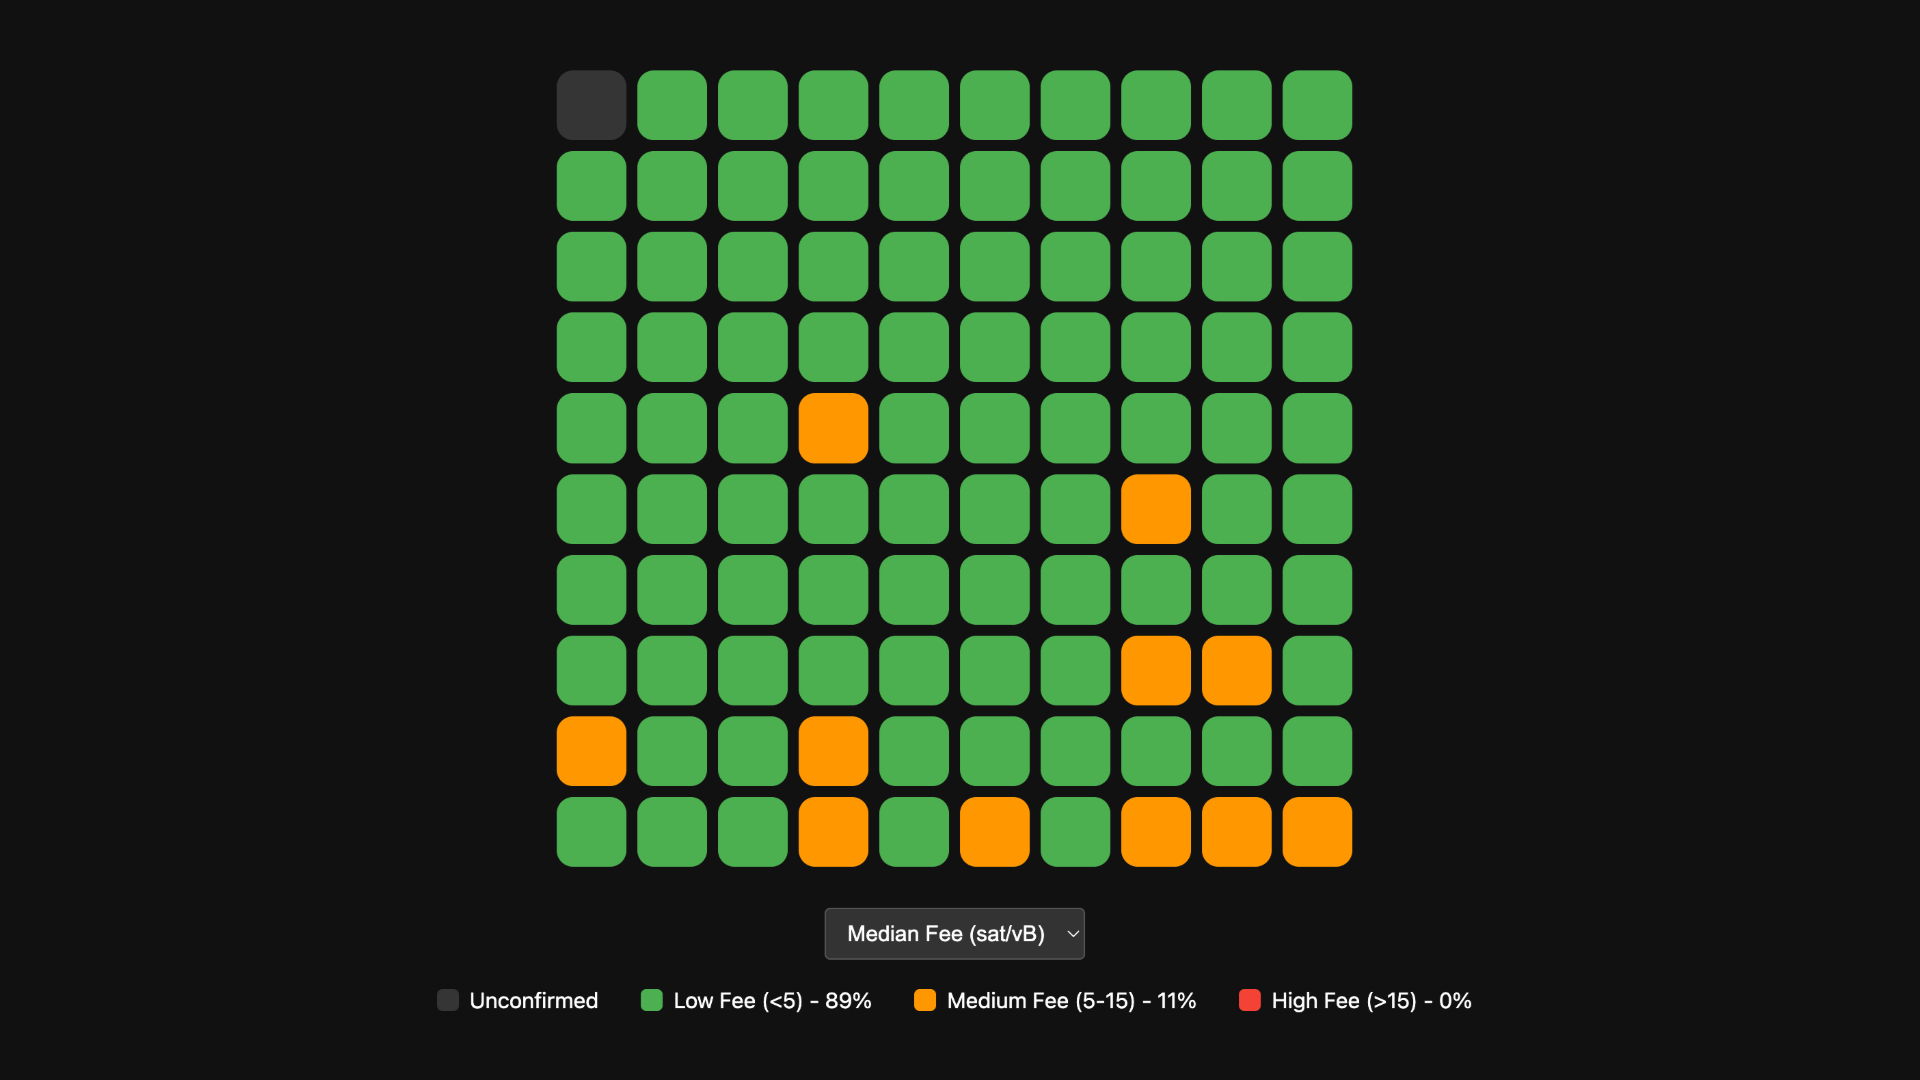
Other Data
We can use this same visual approach to show other data at a glance
Fees
We can display the median fees rate, in this case we see that the recent fees have been low (<5 sat/vB) with only occasional blocks with an elevated fee.
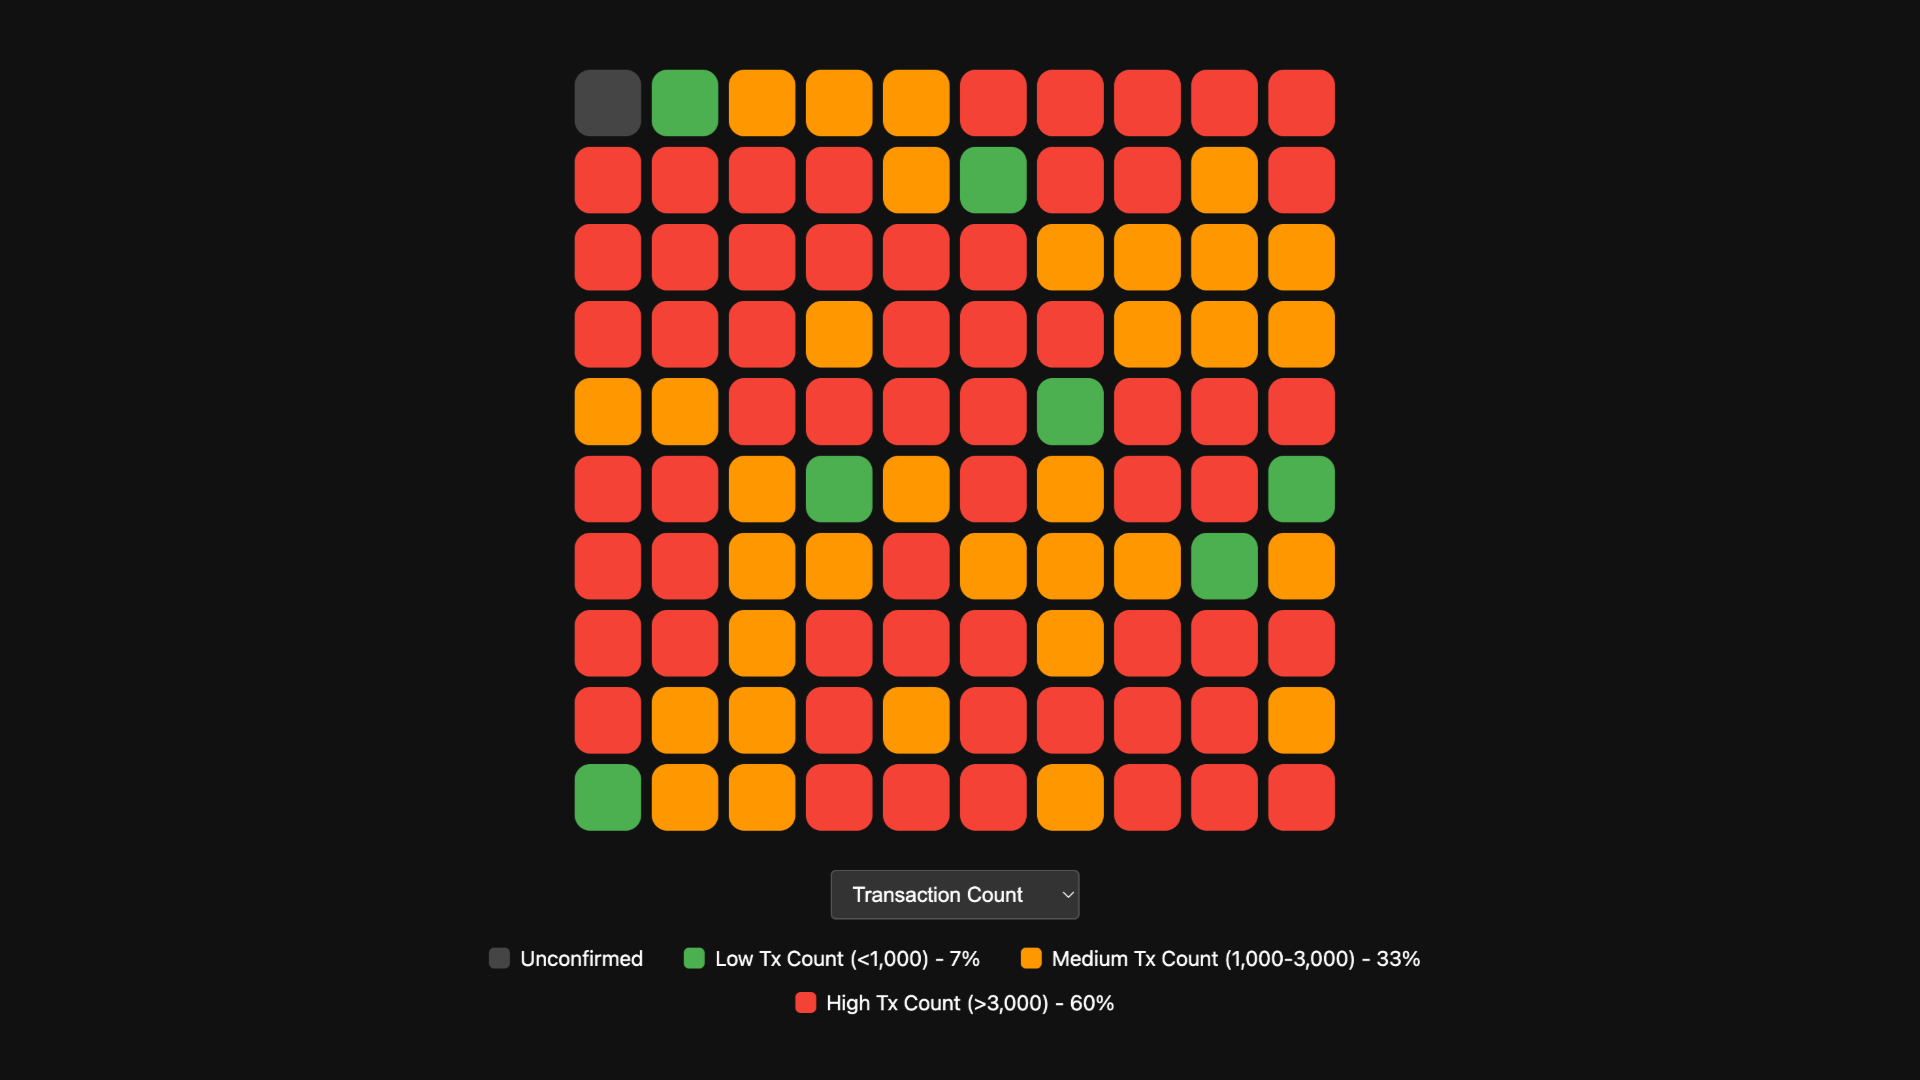
Transaction Count
Next we have the number of transactions per block.
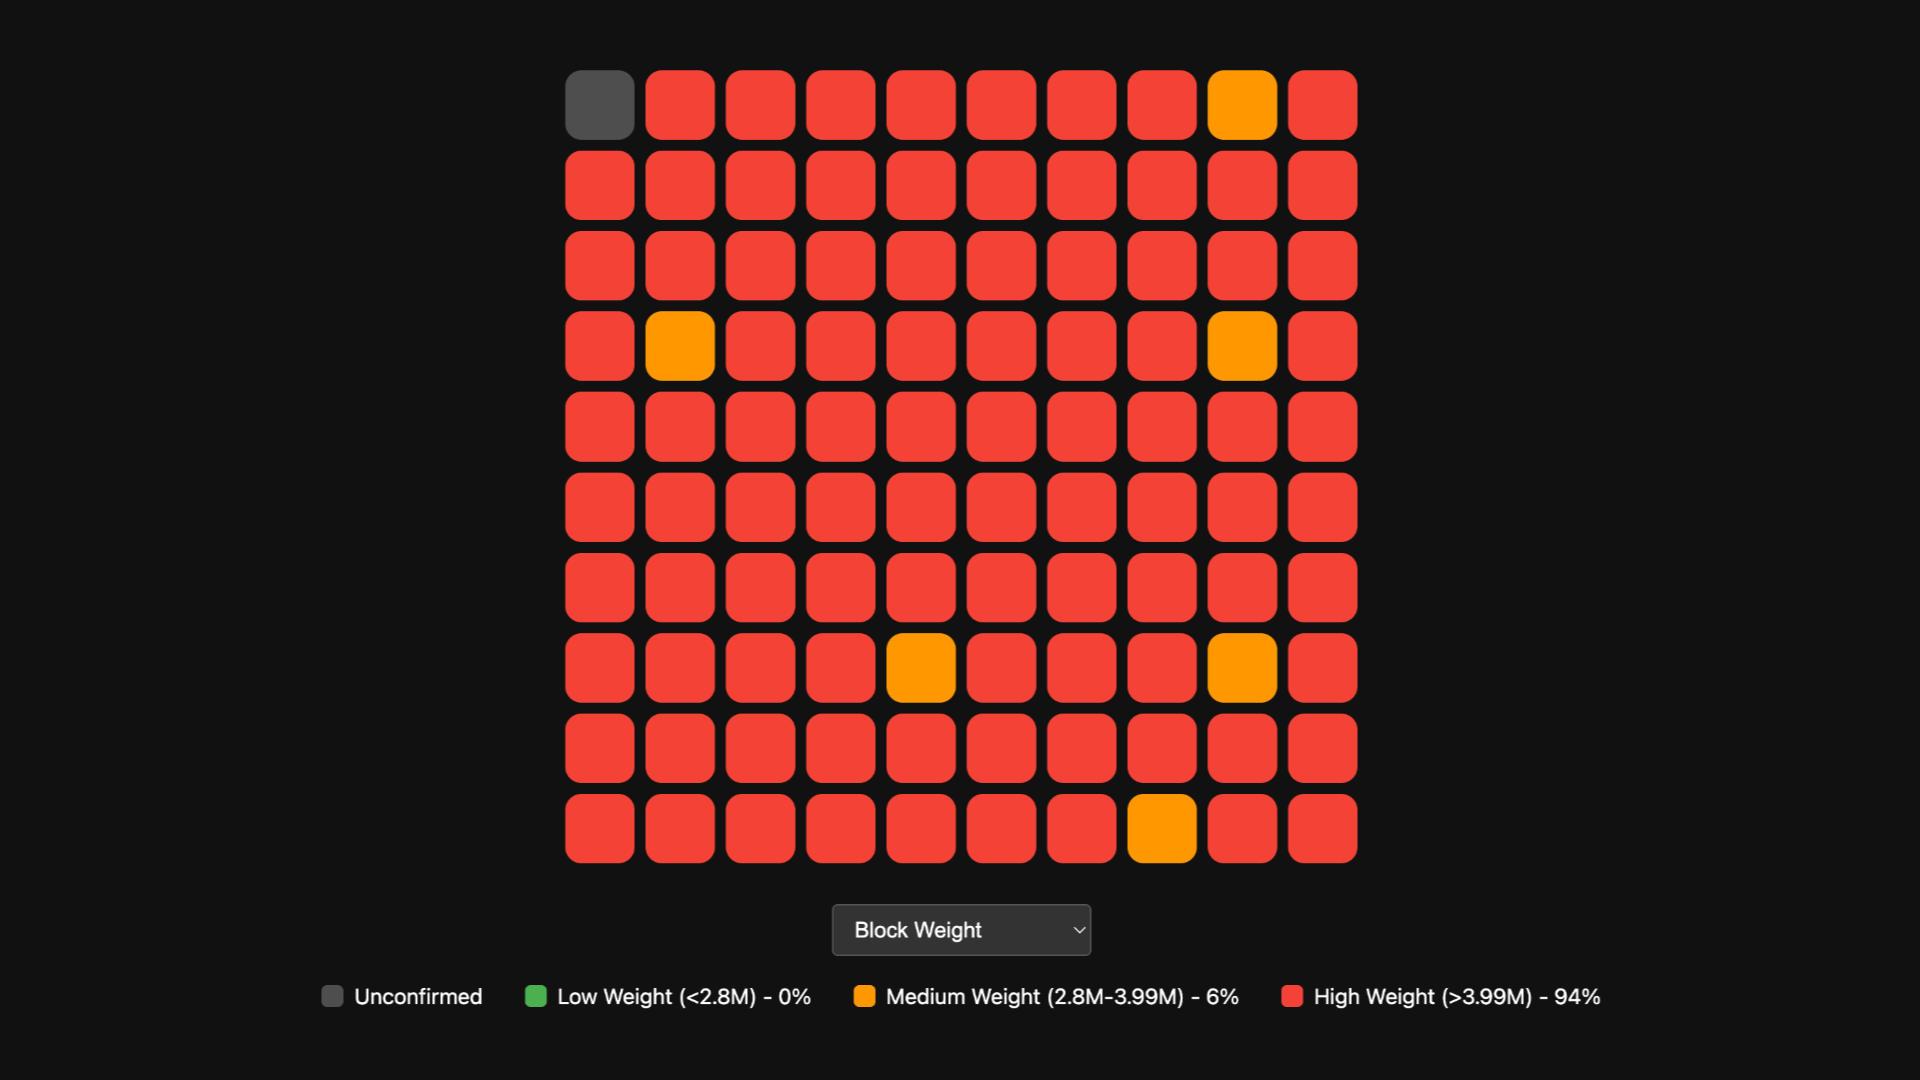
Block Weight
Other Features
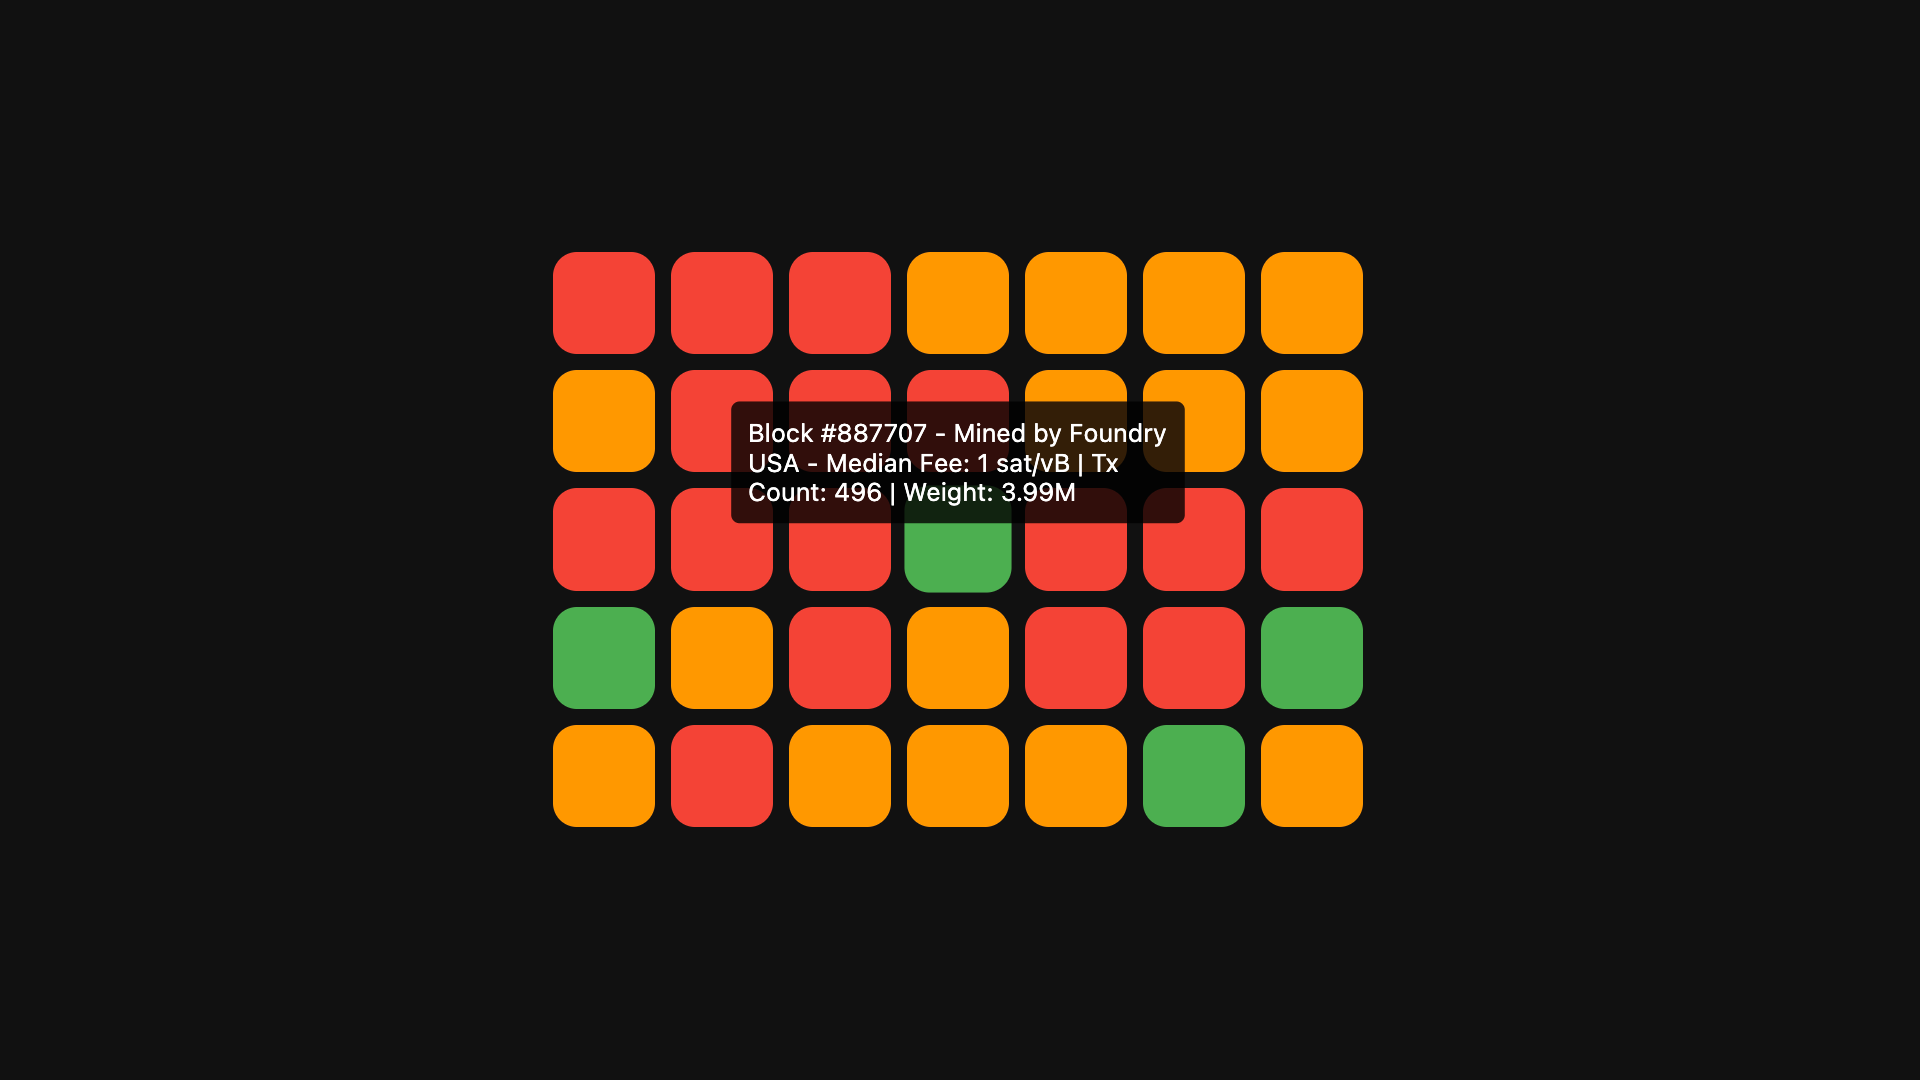
Hover
On desktop we can hover over a block to see more information, such as the block height, the miner name etc. and clicking on the block opens it in mempool.space for deeper review.
If you enjoyed this and find it useful buy me a coffee to keep adding new features like long-term visualisation of thousands of blocks and sorting by clusters.
